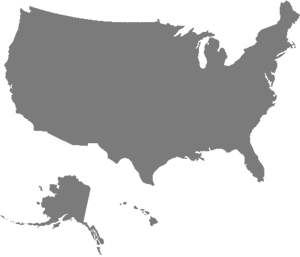
- 25.5% Other Mid-Atlantic
- 13.2% New England
- 12.9% Pacific
- 12.7% International
- 11.3%Midwest & Central U.S.
- 10.9% Pennsylvania
- 10.1% South
- 1.2% Puerto Rico and Territories
Admission Navigation
Office ofAdmission
You are here
The Class of 2019
3468
applied
853
admitted
24.6%
admit rate
40.7%
overall yield
347
total enrolled

Geography
Students hail from 34 states, D.C., Puerto Rico, U.S. Virgin Islands, and 20 countries.
Countries Represented:
-
- Austria
- Canada
- China
- Ethiopia
- Czech Republic
- France
- Ghana
- Hong Kong
- India
- Iran
-
- Japan
- Kenya
- South Korea
- Malawi
- Mauritius
- Philippines
- Russia
- Singapore
- Switzerland
- United Kingdom
Gender
Women : Men
| Women | Men |
|---|---|
| Women | 50.4 |
| Men | 49.6 |
50.4% 49.6%
Academics
Class Rank
Of the enrolled students from high schools that provide rank.
- top 10% of their class 95% (95%)
- top 20% of their class 100% (100%)
Test Scores
- 720 Median SAT Critical Reading
- 720 Median SAT Math
- 720 Median SAT Writing
- 32 Median ACT Composite
Personal Background
Students of Color
- 9.2% African American/Black
- 18.4% Asian/Asian American
- 9.8% Latino
- 1.7% Other
- 16.7% Identify themselves as Multiracial
-
Attendance Number Did not attend 28 Attended 72 28%
Students with at least one parent who did not attend college.
-
Attendance Number Parents speak a language other than English at home 21 Parents speak English at home 79 21%
Students who speak a language other than English at home